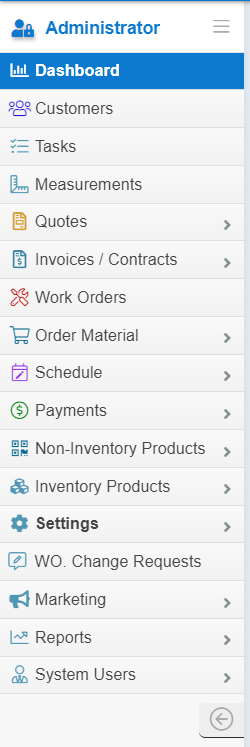
- On the left side of the dashboard, you will see a column with tabs. You can click on these tabs to navigate throughout the Floorzap system. (DashboardOverview1)
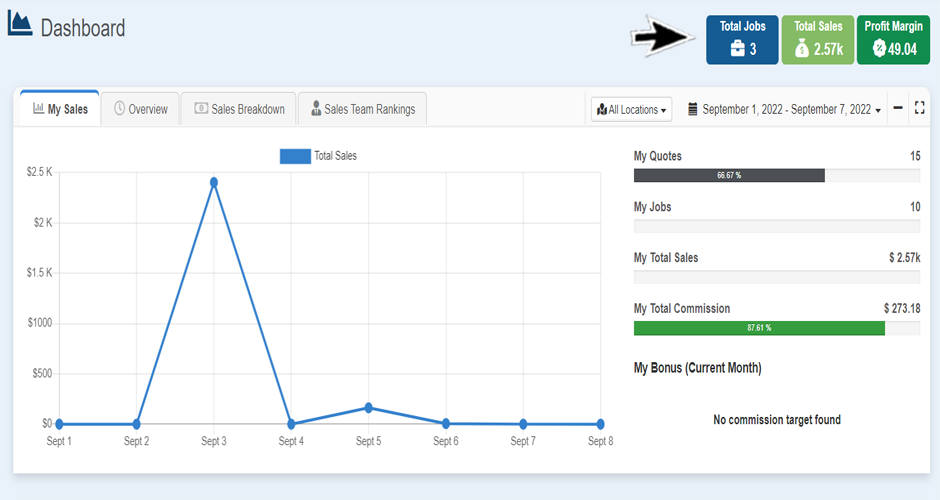
- On the top right of the dashboard, you have a quick overview of the current jobs you have in queue, sales, and profit margin. These will vary by user. The admin will have access to the full company information, individual salespeople will only have access to their numbers.
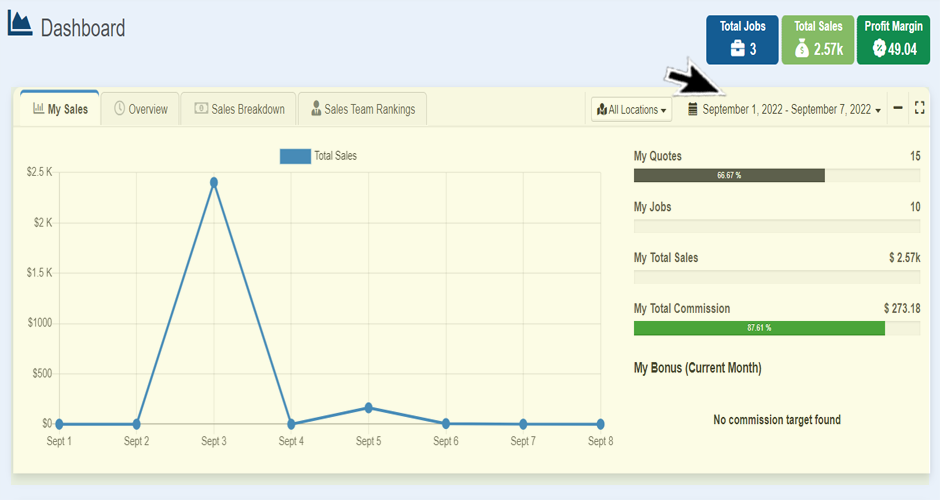
- The highlighted section shown here gives the salesperson an overview of their sales by a selected date range.
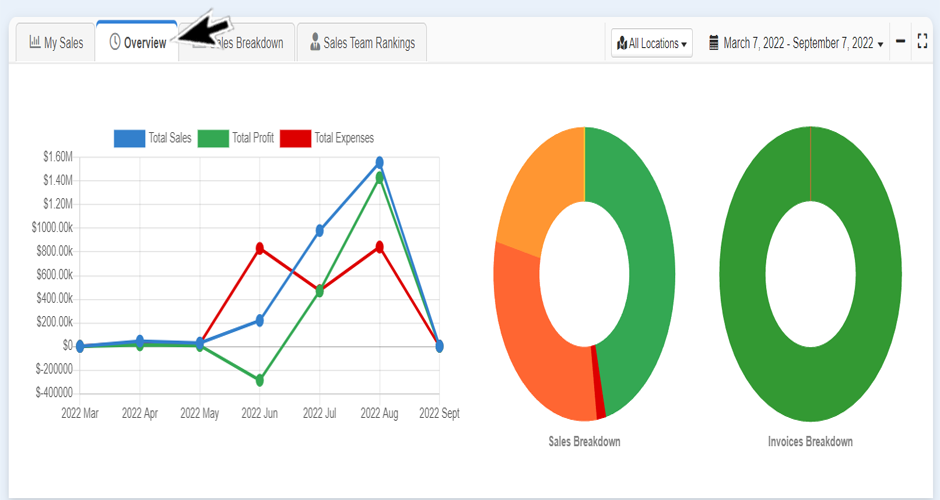
The overview tab shows a further breakdown of sales indicating the total sales, total profit as well as expenses. On the far right you can see how many of your invoices have been paid. This is an admin only view.
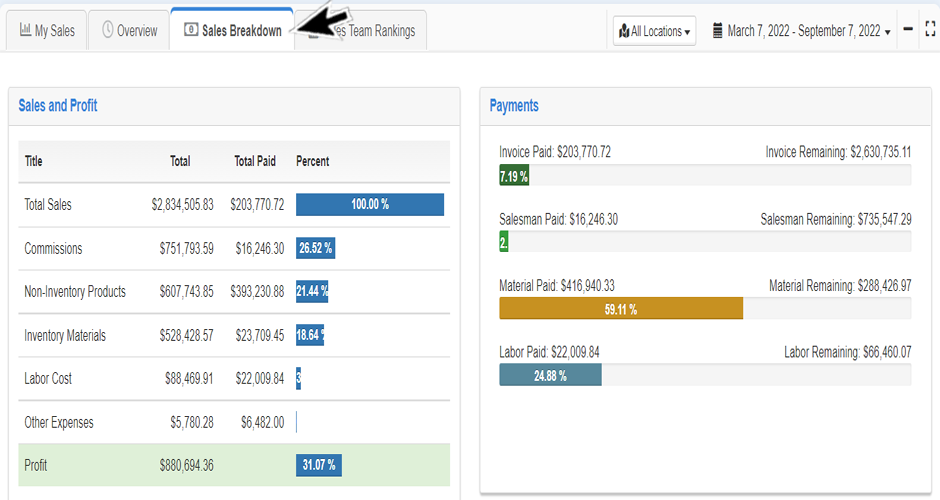
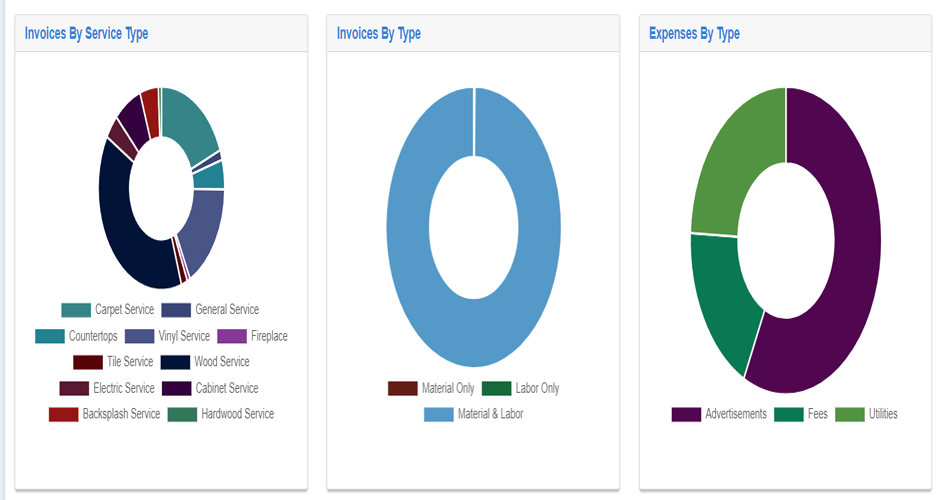
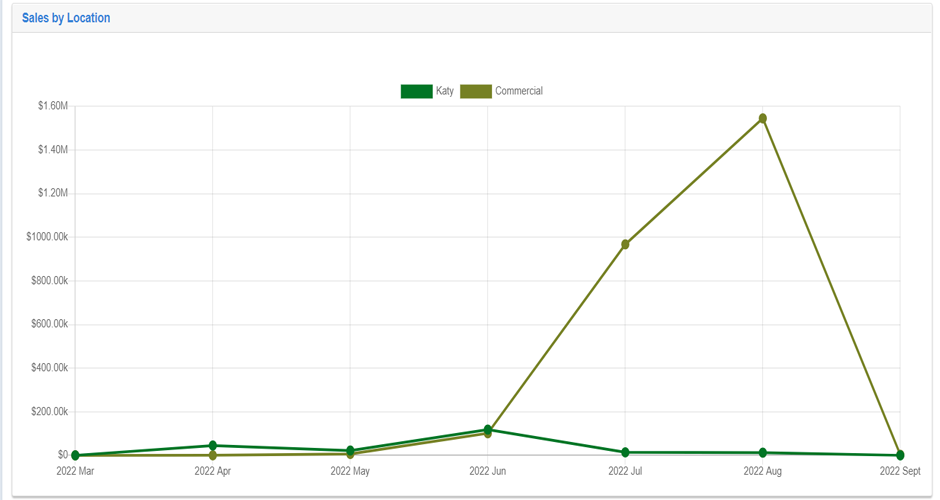
The sales breakdown tab breaks down the sales for the date range selected. You will also be able to see invoices by type and service type, as well as a graph indicating the expenses by type. As well as sales by location if that is applicable.
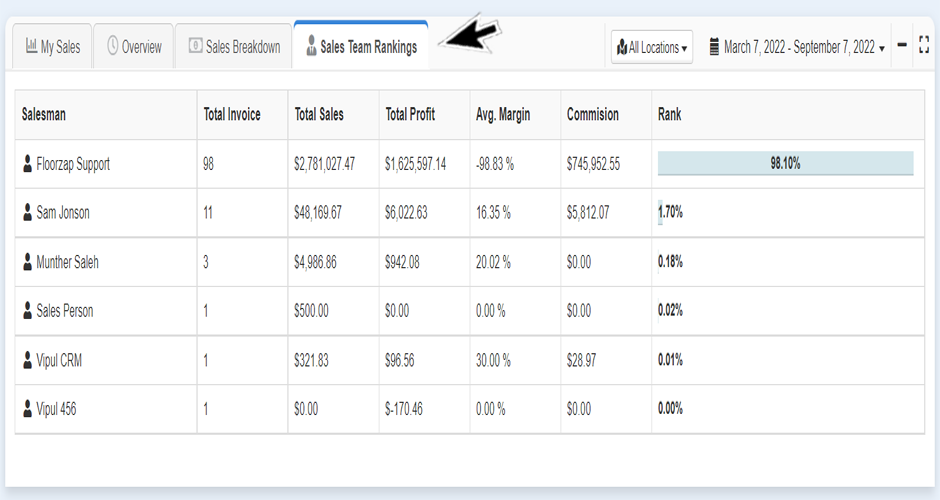
The sales team ranking tab includes a graph documenting the ratings of the sales team.
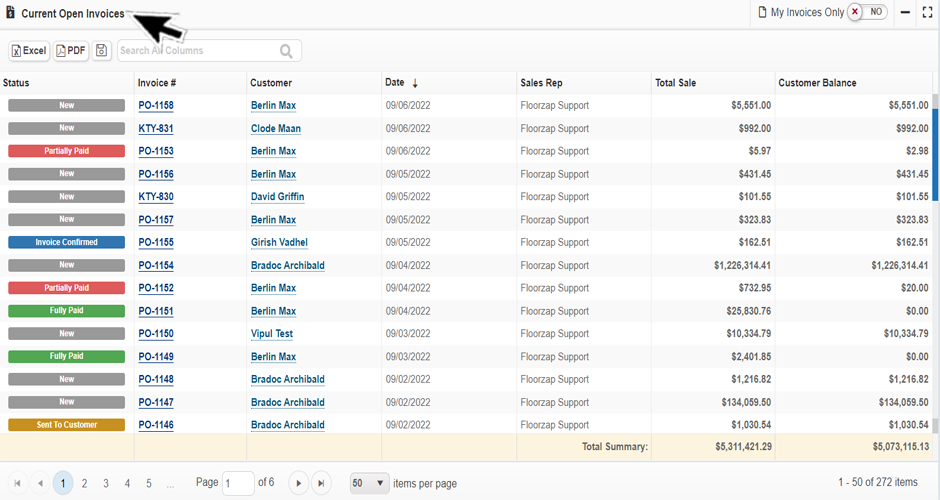
- As you scroll down the main dashboard page you will see your current open invoices displayed.
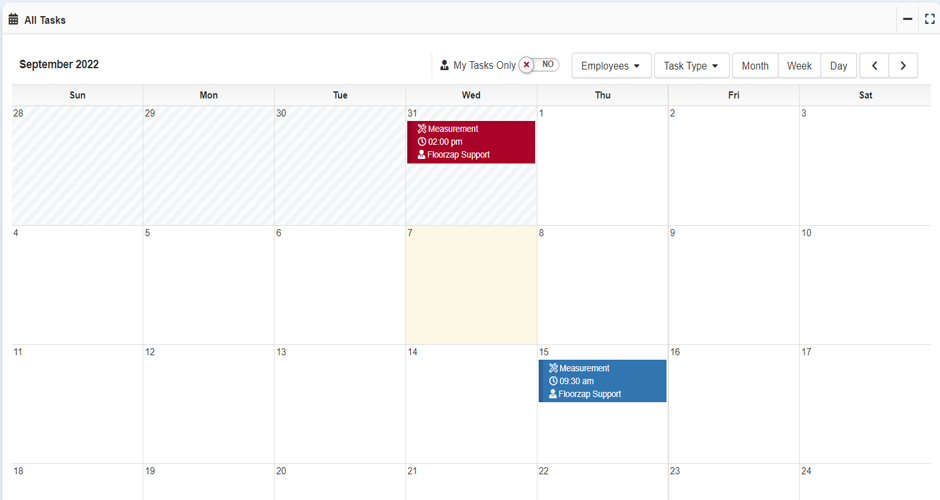
- Last on the dashboard you will find the “all tasks” calendar. This will give you a bird’s eye view of all of the tasks on schedule for the month. You can add tasks directly on this screen by double tapping the date you are wanting to add a task to.
